Features
Everything in the app, in the order of your day.
The homepage tells the story. This page is the inventory: every capability placed where it shows up in an evaluation, with a link into the docs where you want the detail.
Before the visit
Setup happens once. The case carries it forward, so the second observation of a student takes no configuration at all.
Session templates
Save a configuration once, then load it for the next session instead of rebuilding the setup. Docs →
Built-in protocols
Nine research-grounded setups, from classroom engagement to compliance latency. Each arrives with its method, timing, peer cadence and behavior definitions already specified.
Definition library
Built-in behavior definitions plus your own, kept per student. Docs →
ABC tag sets
Per-student antecedent and consequence vocabularies, so tagging matches the case.
Teacher data forms
Print a structured ABC form and let the teacher collect between your visits. When it comes back, entry takes minutes and the indirect data gets its own analysis.
In the classroom
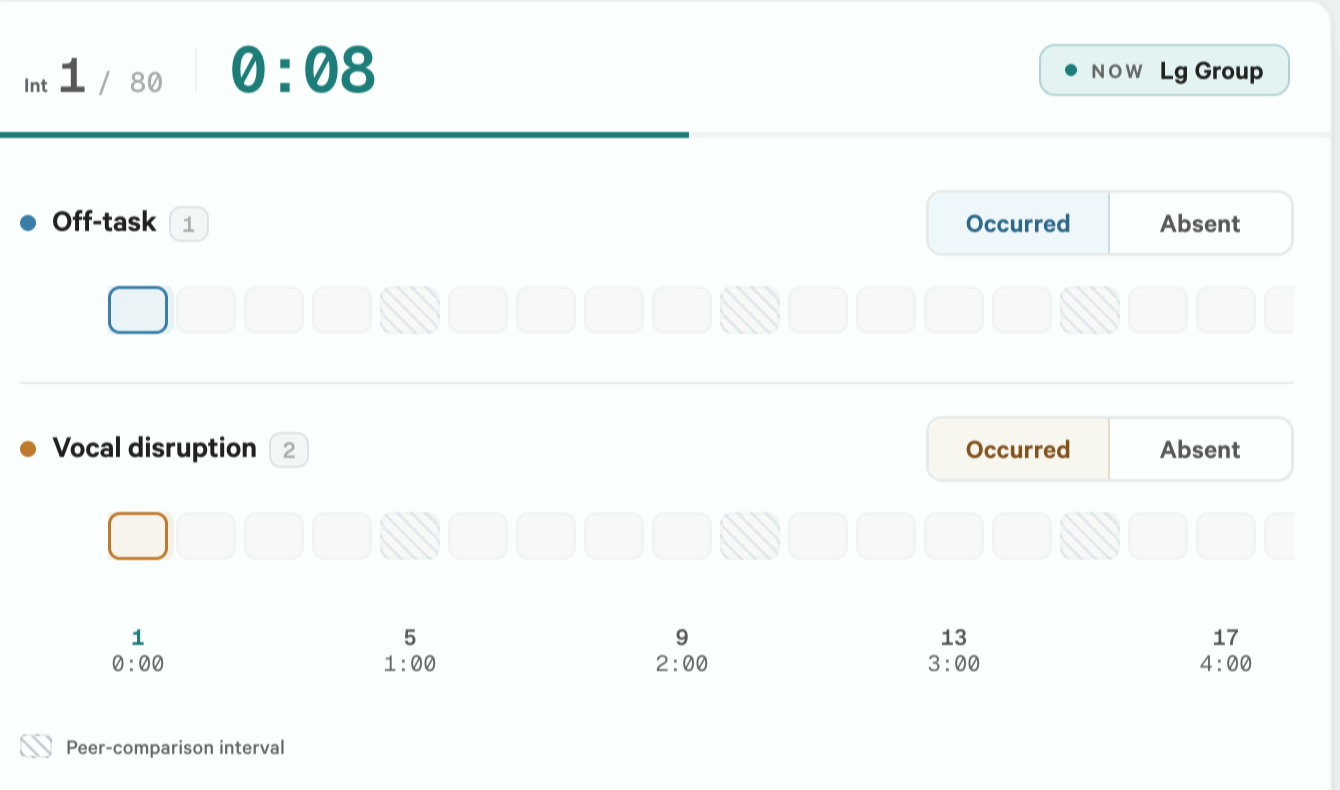
Hands on the keys, eyes on the student. The app runs the clock, the interval count and the boundary cues; you supply the judgment.

Choosing the instrument
All eight are in the free tier, chosen per session. The last two produce a record you read afterward rather than a number.
Protocol notes, cadence and peer settings in the docs →
Keyboard-first scoring
Every action is a single keypress, undo included. No menu to open, nothing to find on screen. Up to five operationally defined behaviors in one pass. Docs →
Timing and cues
The app runs the clock, the interval count and the boundary cues. You score when prompted. Sessions run 5 to 60 minutes, intervals 5 to 60 seconds. Docs →
Activity context
Mark the classroom activity as it changes: large group, independent work, transition. Results filter by it later. Docs →
Notes and observation log
Drop a timestamped note without stopping the clock.
Quick phrases and hashtags
Reusable phrases and tags for fast narrative entry, kept in your own library. Docs →
Peer comparison
Score a peer in parallel for a same-classroom reference point, on a cadence you set.
iPhone companion
Voice notes and activity changes captured from your pocket and transcribed on device into the timestamped log. Docs →
No mid-session percentages
Running rates wait for Results, so each interval is scored on what you saw rather than on the total so far.
Crash recovery
Continuous autosave. The next launch offers resume or discard, closes dangling duration episodes and explains what it dropped.
Back at your desk
The analysis is on the screen before you are. Every mark was logged as it happened, so there is no evening spent moving a paper form into a spreadsheet.
Session results
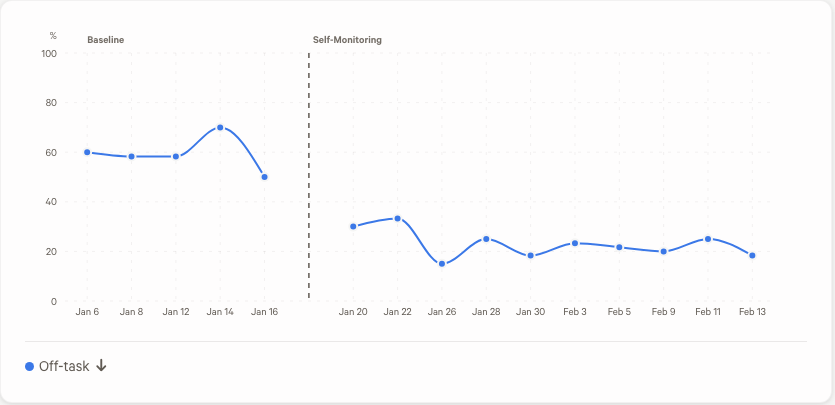
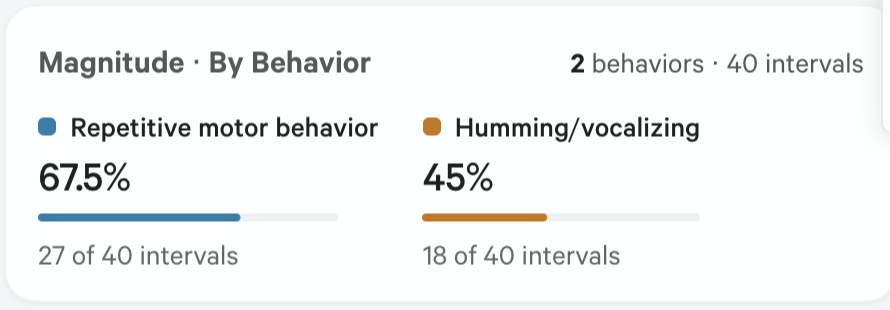
Counts, rates and the method’s native chart the moment you stop recording. Docs →
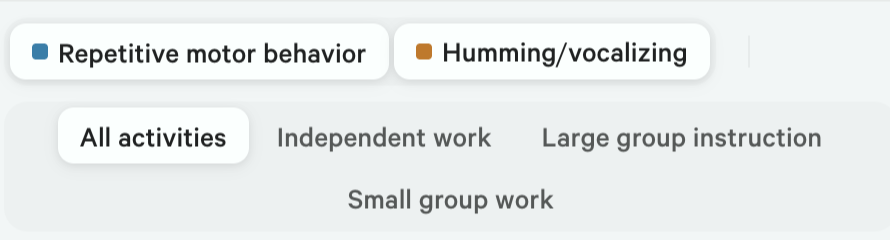
Filter by activity
Every statistic recomputed for just independent work, or just transitions. Patterns tied to task structure surface on their own.
Phases
Name a baseline or intervention phase and give it a date range. Saving it retroactively re-tags every session in that range, so comparison works on data you already collected.
Cross-session comparison
Sessions on one chart with the phase line drawn: phase means, the size of the change, overlap. Docs →
Manual entry
Transcribe paper notes or back-date a session after the fact, in a grid or entry by entry, with session-relative or wall-clock timestamps. Docs →
ABC patterns
Antecedent-consequence chains, conditional probability tables and pattern rankings across sessions. Docs →
AI session summaryAI
A narrative of the session written from the coded data, every claim checked against the statistics before it reaches you.
The write-up
From evidence to a signed document. The draft opens beside the sessions it cites, and every number in it was computed from your intervals rather than generated.
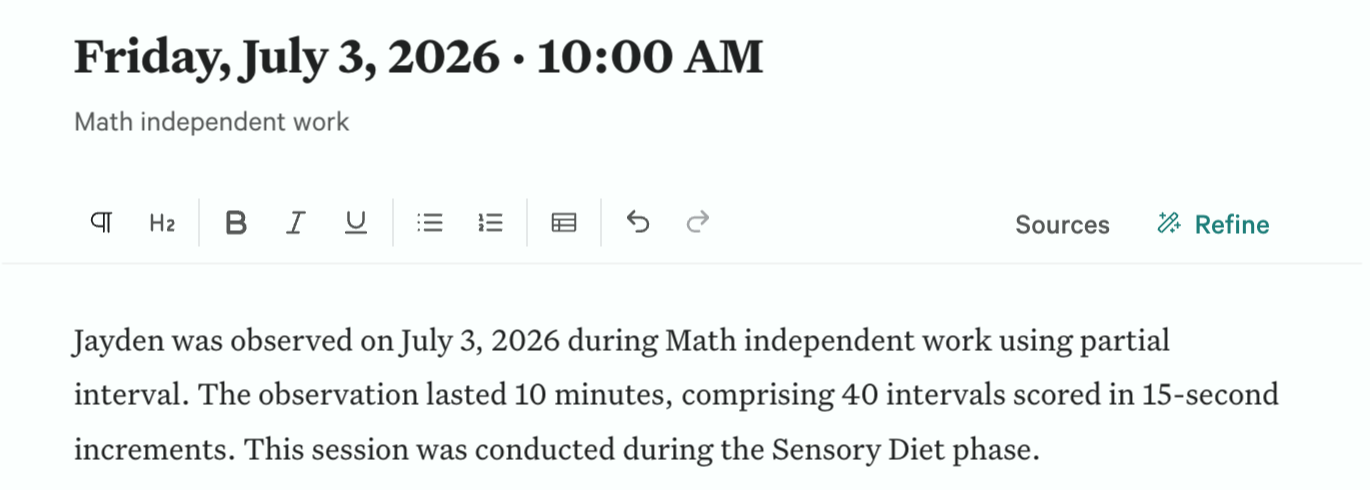
Two workspaces
Observation summaries and FBA narratives, each with the draft on one side and the evidence it cites on the other. Docs →
AI drafting, on deviceAI
A model trained on behavioral observations writes the first pass without leaving your machine.
Refine with a visible diffAI
Rewrite, tighten or translate a selection. Before and after, side by side, accept or reject.
Evidence citations
Click a note, metric or ABC chain to insert it with its provenance attached. The draft stays traceable to the sessions.
Hypothesis draftingAI
For FBAs, a functional hypothesis drafted from the convergent evidence, in your hands to edit and sign. The FBA workspace →
Everything leaves cleanly
PDF or Word reports with the figures embedded, CSV of the raw data, plain text. Nothing about your work is locked inside the app. Docs →
Questions people actually ask.
Does the AI make up numbers?
No. Every statistic in a draft is computed from your intervals and passed through a validator that checks each claim against the underlying data. The model writes prose around numbers it is given; it does not produce them.
Where does student data live?
On your machine, in one file. There is no account, no sync service and no vendor-side copy. Full detail on the privacy page.
Can I use it without internet?
Yes. Recording, analysis, AI drafting and companion pairing all work offline. A licensed copy checks in roughly every seven days.
What if I stop paying?
Everything you have recorded stays on your machine. CSV export and backup and restore are free-tier features, so the raw data comes with you regardless of license.
Does it run on Windows?
Yes. Windows x64, Apple Silicon Macs and Intel Macs are all supported.
What does the free tier actually do?
All eight recording methods, session results, CSV export, and backup and restore. It is a working instrument, not a demo with the useful parts removed.
Not seeing the thing you need?
This page is the full inventory, so if a capability is not on it, it does not exist yet. Tell us what is missing and it goes on the list.